Public finance · Inequality · Original descriptive analysis
Who Receives Brazil's Pension Money? Four Distributional Tests of a System Without a Linked Recipient Count
Brazil cannot say how many people receive a public pension across all its regimes, and it publishes no pension-only flow for judges or prosecutors. What it can measure gives a split answer: half of the main regime's recipients get exactly the floor, a small high-benefit tail takes a large share of payments, civil-service pensions are concentrated near the top, and the means-tested benefit for the poor and disabled lifts more people out of poverty per real than pensions do.
Abstract
Who receives Brazil's public pension money, and is the system progressive? This paper assembles administrative records from the Ministry of Social Security, PNAD Contínua 2025 microdata, published POF 2017–2018 incidence estimates, a 2019 World Bank fiscal-incidence study, and a lifetime-return study of one federal cohort, and applies four separate tests. Counting: 40.564 million active INSS-administered benefit records belonged to 36.468 million people in December 2024; adding civil and military inactive records gives an upper accounting bound of 41.579 million, but no public source removes cross-regime overlap. Distribution: 49.64% of RGPS and EPU recipients receive exactly one pension floor and hold 30.87% of monthly value, while PNAD recipients above the RGPS ceiling are 3.51% of recipients and receive 19.44% of reported payments. Benefit incidence: in POF 2017–2018 the concentration coefficient was −0.083 for BPC, 0.433 for RGPS, and 0.821 for civil-service RPPS, against an income Gini of 0.535. Poverty: removing public pensions arithmetically raises the half-minimum-wage poverty rate from 23.1% to 34.7%; per R$1 million of monthly payments, BPC has 691 static poverty exits against 314 for pensions. Lifetime: in the 2018 federal Executive retiree cohort, estimated internal returns rose from 4.2% in the bottom income quartile to 5.5% in the top. The tests do not reduce to one label. The paper reports seven questions that current public data cannot answer.
Brazil's pension spending has no single distributional character: BPC is pro-poor (concentration −0.083), RGPS benefits are less concentrated than income (0.433 vs a 0.535 Gini), civil-service RPPS benefits are highly concentrated (0.821), BPC lifts about twice as many people above half a minimum wage per real as pensions, and one federal cohort shows lifetime returns rising with income — while no public source can count unique recipients across regimes or isolate judge and prosecutor pensions.
The question
Brazil spends about 12.4% of GDP on public pension systems [17]. Who receives that money, and does it flow mainly to people who would otherwise be poor or to people with high prior incomes?
The usual answers use a single word: the system is called "regressive" by critics of civil-service privileges and "the largest anti-poverty program in the country" by its defenders. Both describe parts of it. The question here is narrower and testable: what do separate counting, distribution, incidence, poverty, and lifetime tests show, and what can public data not tell us at all?
Why it matters
Under the official current-rules baseline, spending in the general regime alone rises from 8.26% of GDP in 2026 to 16.76% in 2100 [16], so further reform is likely. A reform that cuts across all regimes at once treats a minimum benefit for a rural widow and a full-salary pension for a senior official as the same promise. A reform aimed at one group requires knowing how much money that group receives. Brazil cannot currently answer several basic versions of that question, and a reform debate conducted without the answer tends to fall back on slogans. Identifying which claims the data support, and which they cannot support, matters for any of the possible reforms.
Data and definitions
- Administrative records. The Ministry of Social Security's 2024 statistical yearbook (AEPS) gives active INSS-administered benefit records, unique beneficiaries, benefit multiplicity, and benefit bands [1–3]. The 2024/2025 RPPS supplement gives civil and military records, expenditure, and financial results by system and federal branch [4].
- Household survey. PNAD Contínua 2025 annual first-visit microdata give pension and BPC receipt, household income, and contribution status [5]. Public pensions in PNAD pool RGPS and RPPS, and survey pension income is underreported relative to administrative totals.
- Published incidence studies. Concentration coefficients by program from POF 2017–2018 [6]; pension-contribution incidence from the same survey [7]; and a comprehensive 2019 fiscal-incidence analysis [8].
- Lifetime returns. One cohort study of federal Executive civil servants who retired in 2018 [9].
Programs are kept separate throughout. RGPS is the general regime for private-sector workers and some public employees, administered by INSS. EPU are legacy federal obligations paid through INSS. RPPS are the civil-service regimes of the Union, states, and municipalities. Military systems are separate. BPC is a means-tested, non-contributory benefit for poor older people and people with disabilities, worth one minimum wage; it is assistance, not a pension, and sits outside the 12.4%.
Result 1: a benefit record is not a person
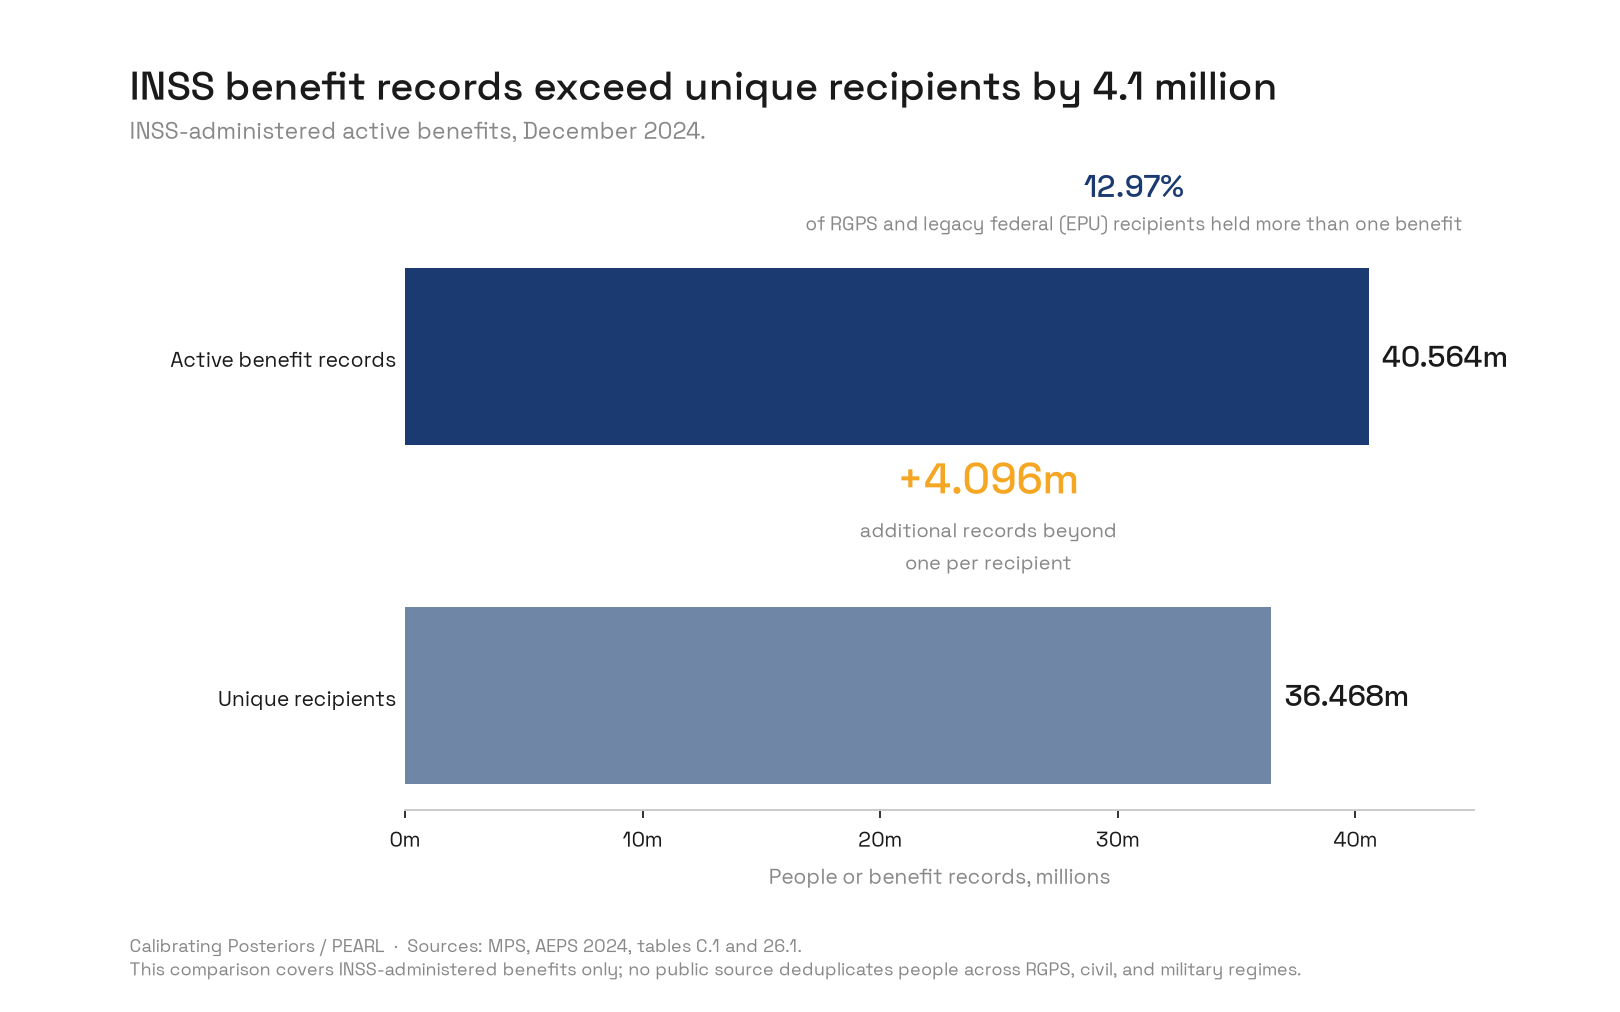
In December 2024 there were 40.564 million active INSS-administered benefit records [1] and 36.468 million unique people holding them [2]: 4.096 million records beyond one per person. Within RGPS and EPU, 12.97% of the 30.2 million recipients held more than one benefit, almost all of them exactly two [3].
That count stops at INSS. Civil and military regimes reported 5.110 million inactive administrative records (retirees plus survivor pensioners) in 2024 [4]. Adding them gives a crude bracket of 36.468 to 41.579 million. The lower end is confirmed people; the upper end counts records from systems that are not linked and may share people. It is an accounting bound, not a confidence interval, and no public national source produces the exact cross-regime unique-recipient total.
Result 2: a broad floor and a small high-benefit tail
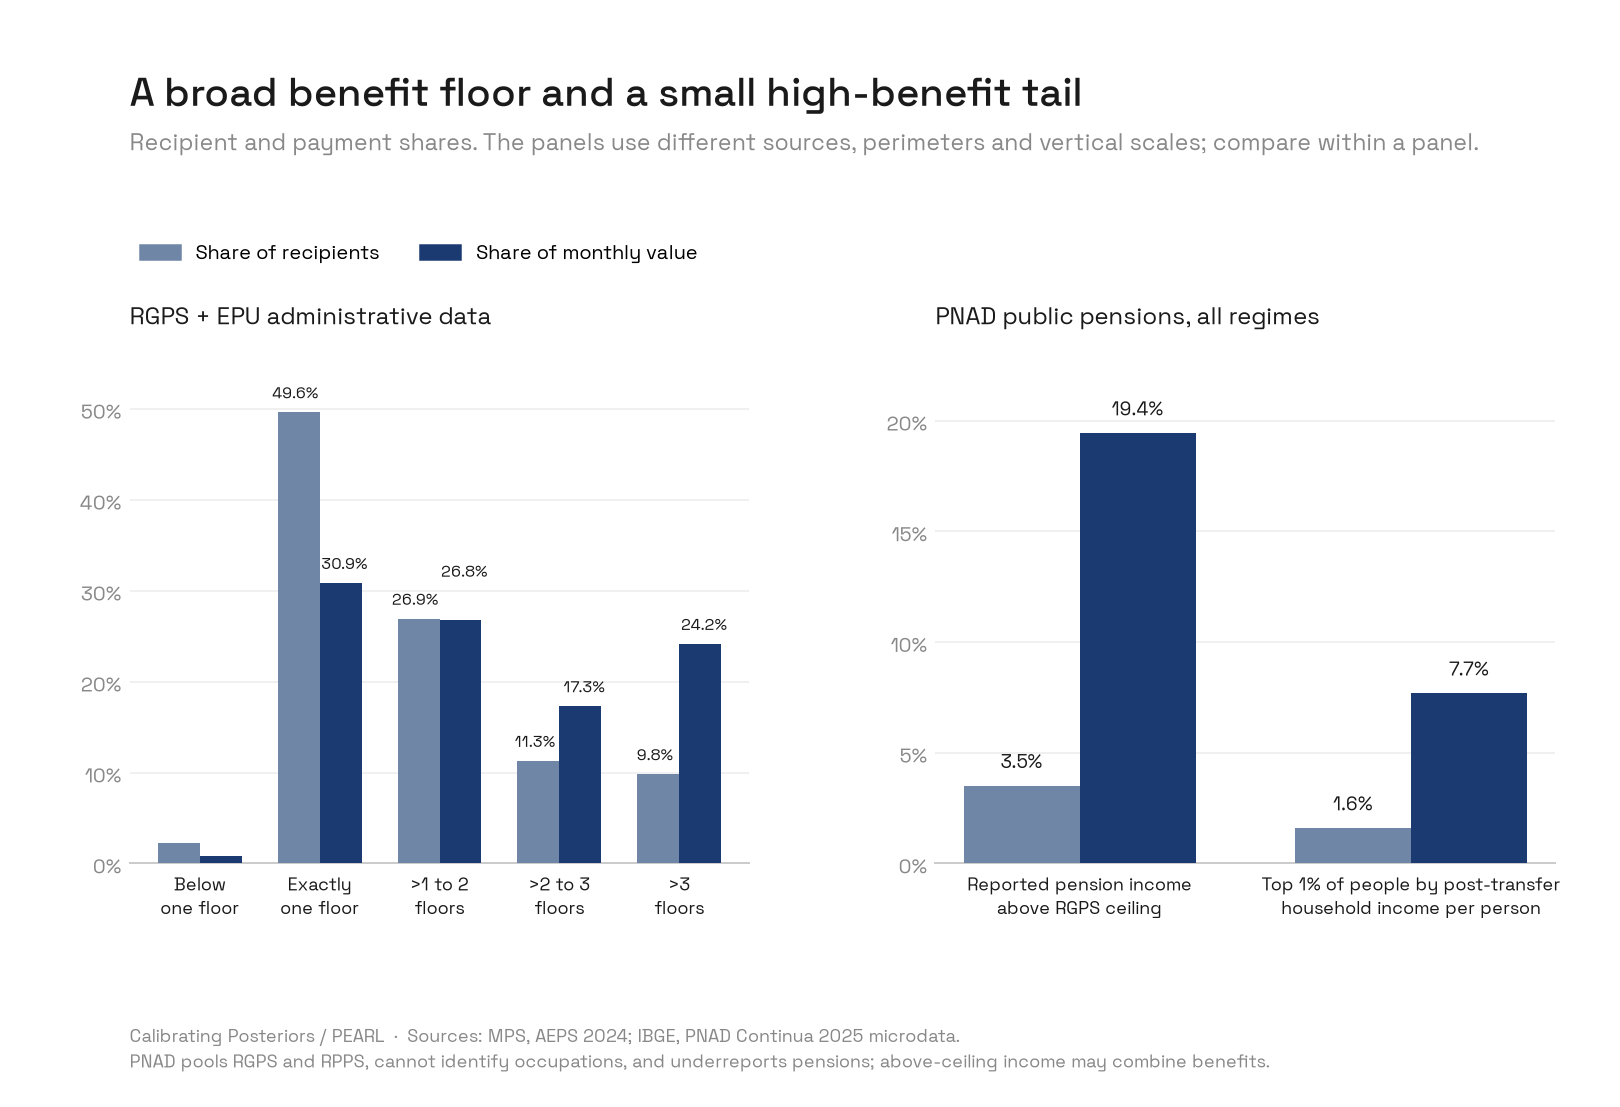
Among 30.2 million RGPS and EPU recipients in December 2024, 15.0 million received exactly one pension floor: 49.64% of recipients holding 30.87% of monthly value [3]. Fewer than 10% received more than three floors, and that group held 24.2% of value.
The survey view adds the other regimes but loses precision. In PNAD 2025, recipients reporting public-pension income above the 2025 RGPS ceiling of R$8,157.41 were 3.51% of pension recipients and received 19.44% of reported pension payments [5]. Recipients among the top 1% of people, ranked by post-transfer household income per person, were 1.60% of pension recipients and received 7.69%. The two measures answer different questions: the first identifies a high-benefit tail, which can include people combining benefits; the second identifies people in affluent households. Neither identifies occupation or regime.
Result 3: civil and military regimes, and what cannot be isolated
The civil and military systems are visible at the level of the regime and, for the Union, the branch [4]:
| System, 2024 | Inactive records | Expenditure (R$ bn) | Financial result (R$ bn) |
|---|---|---|---|
| Municipal civil RPPS | 1,279,230 | 89.1 | +1.2 |
| State and Federal District civil RPPS | 2,117,283 | 200.1 | −95.0 |
| State and Federal District military | 471,737 | 58.6 | −46.6 |
| Union civil RPPS | 801,371 | 97.1 | −55.8 |
| Union military | 409,006 | 60.0 | −50.8 |
| Federal District Constitutional Fund | 31,665 | 9.6 | −8.6 |
| Total | 5,110,292 | 514.5 | −255.6 |
Records are administrative categories, not verified unique people, and expenditure is the broader RREO system concept rather than a pure benefit flow. The two military systems alone reported a combined shortfall of about R$97.4 billion. In the Union's civil regime, the mean monthly remuneration of retirees was about R$11,090 in the Executive, R$22,092 in the Judiciary, R$22,843 in the Public Prosecution, and R$35,542 in the Legislature [4]. These branch means include clerks, analysts, and other staff alongside judges, prosecutors, and legislators.
That is as far as public data go for the highest-paid careers. The National Council of Justice counted 19,094 active magistrates in 2025 [10], and the Union civil data contain 44,004 inactive Judiciary-branch records with an implied annual payroll near R$11.48 billion [4]. But that branch includes staff and excludes state judiciaries, and the Council's remuneration panels mix salaries, indemnities, and retroactive payments. The prosecution service publishes member counts (13,611 members and 38,302 staff in 2024) [11] but no national pension flow. No defensible national judge-only or prosecutor-only pension total can be built from the audited public sources.
Result 4: benefit incidence differs sharply by program
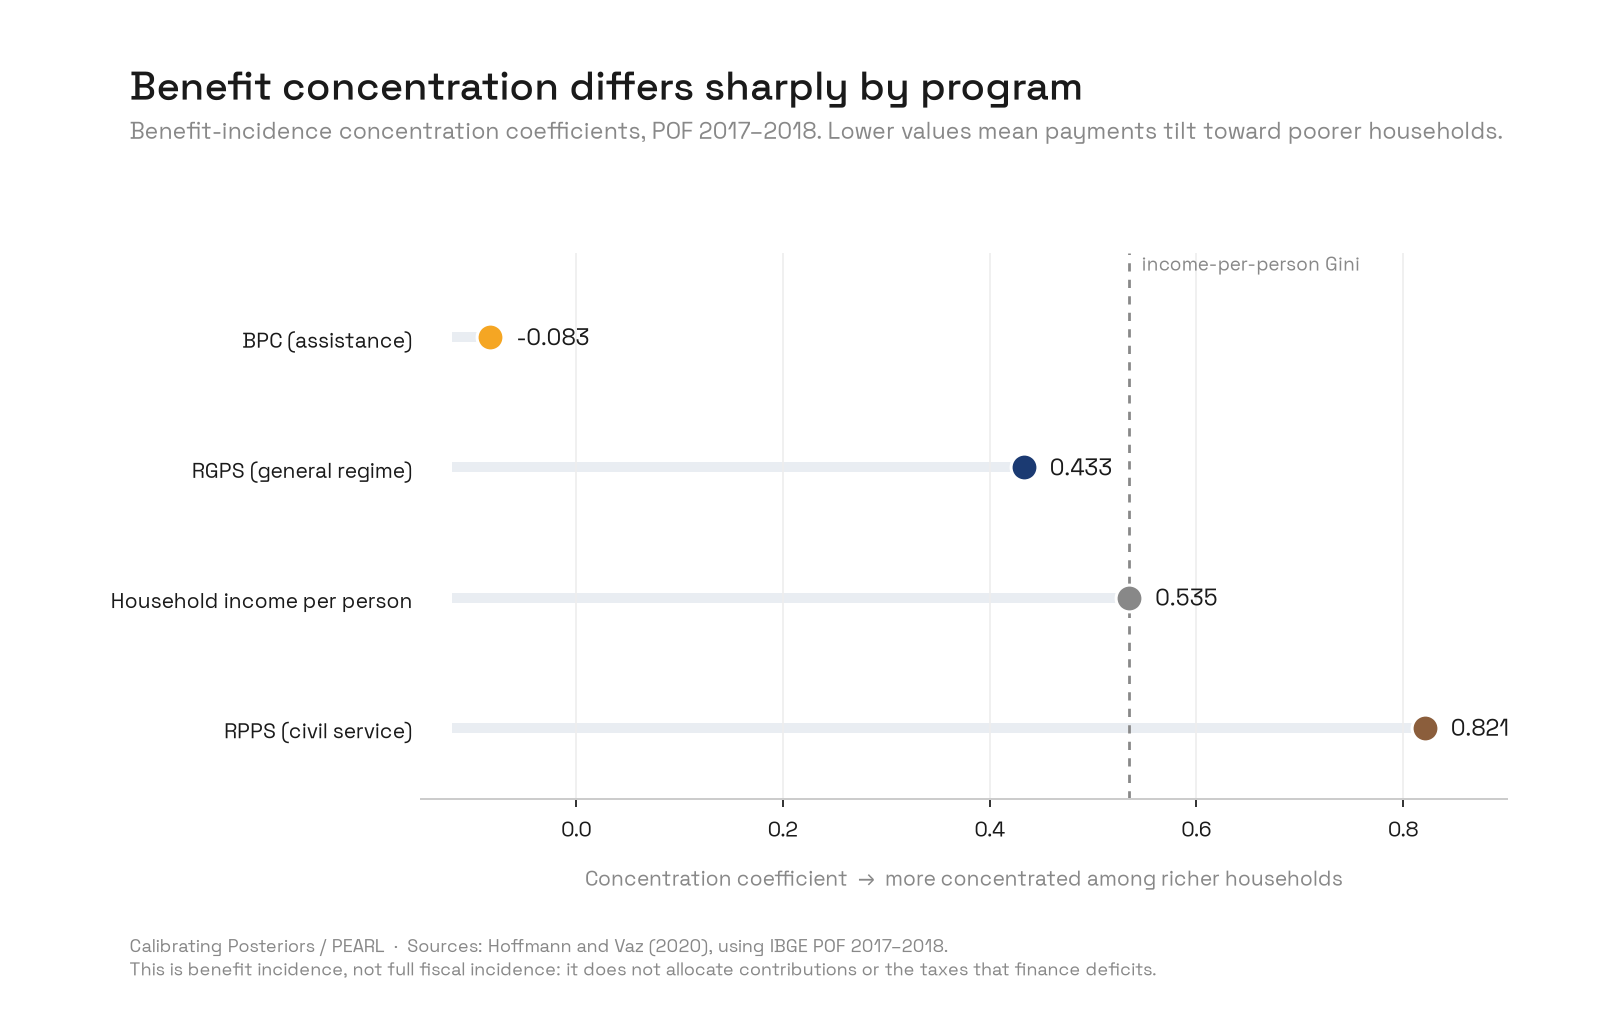
Hoffmann and Vaz decompose household income in POF 2017–2018 by source [6]. A concentration coefficient below the income Gini means the component reduces inequality relative to the existing distribution; above it, the component concentrates income further up. BPC scored −0.083, reaching poorer households disproportionately. RGPS scored 0.433, below the household per-capita income Gini of 0.535, so its benefits reduced inequality relative to income even though they are not targeted at the poor. RPPS scored 0.821, far more concentrated than income. The pattern was stable across surveys: in POF 2008–2009 the coefficients were −0.104, 0.480, and 0.822 against a Gini of 0.561.
Result 5: financing incidence is only partly observable
Ipea's analysis of the same survey measures the household burden of official pension contributions, pooling RGPS and RPPS [7]:
| Household-income band | Households paying | Contributions as share of all household income | Share among households that paid |
|---|---|---|---|
| 0–1 minimum wage | 11.3% | 0.69% | 6.10% |
| More than 36 minimum wages | 84.5% | 2.87% | 3.39% |
Across all households the contribution share rises with income to 3.87% in the 18–36 minimum-wage band and falls at the top. Participation drives that pattern: within paying households, the lowest band bears the heaviest burden. The calculation excludes employer contributions and the general taxes that finance deficits, which together pay a large part of the bill. Financing incidence therefore cannot be settled with current published data.
Result 6: pensions prevent a great deal of poverty; BPC more per real
PNAD 2025 allows a static test: remove each transfer from reported household income and recount poverty, with no behavioral response [5].
| Poverty line (monthly, per person) | Poverty rate | Without public pensions | Without BPC |
|---|---|---|---|
| Bolsa Família benchmark, R$218 | 3.2% | 11.1% | 4.9% |
| Half a minimum wage, R$759 | 23.1% | 34.7% | 25.3% |
| One minimum wage, R$1,518 | 51.9% | 62.7% | 53.2% |
At half a minimum wage, public pensions keep about 24.7 million people above the line and BPC about 4.7 million. Removing pensions raises the Gini of household income per person from 0.511 to 0.565. Because PNAD pools RGPS and RPPS, the effect cannot be assigned to the pension floor, rural benefits, or civil-service pensions.
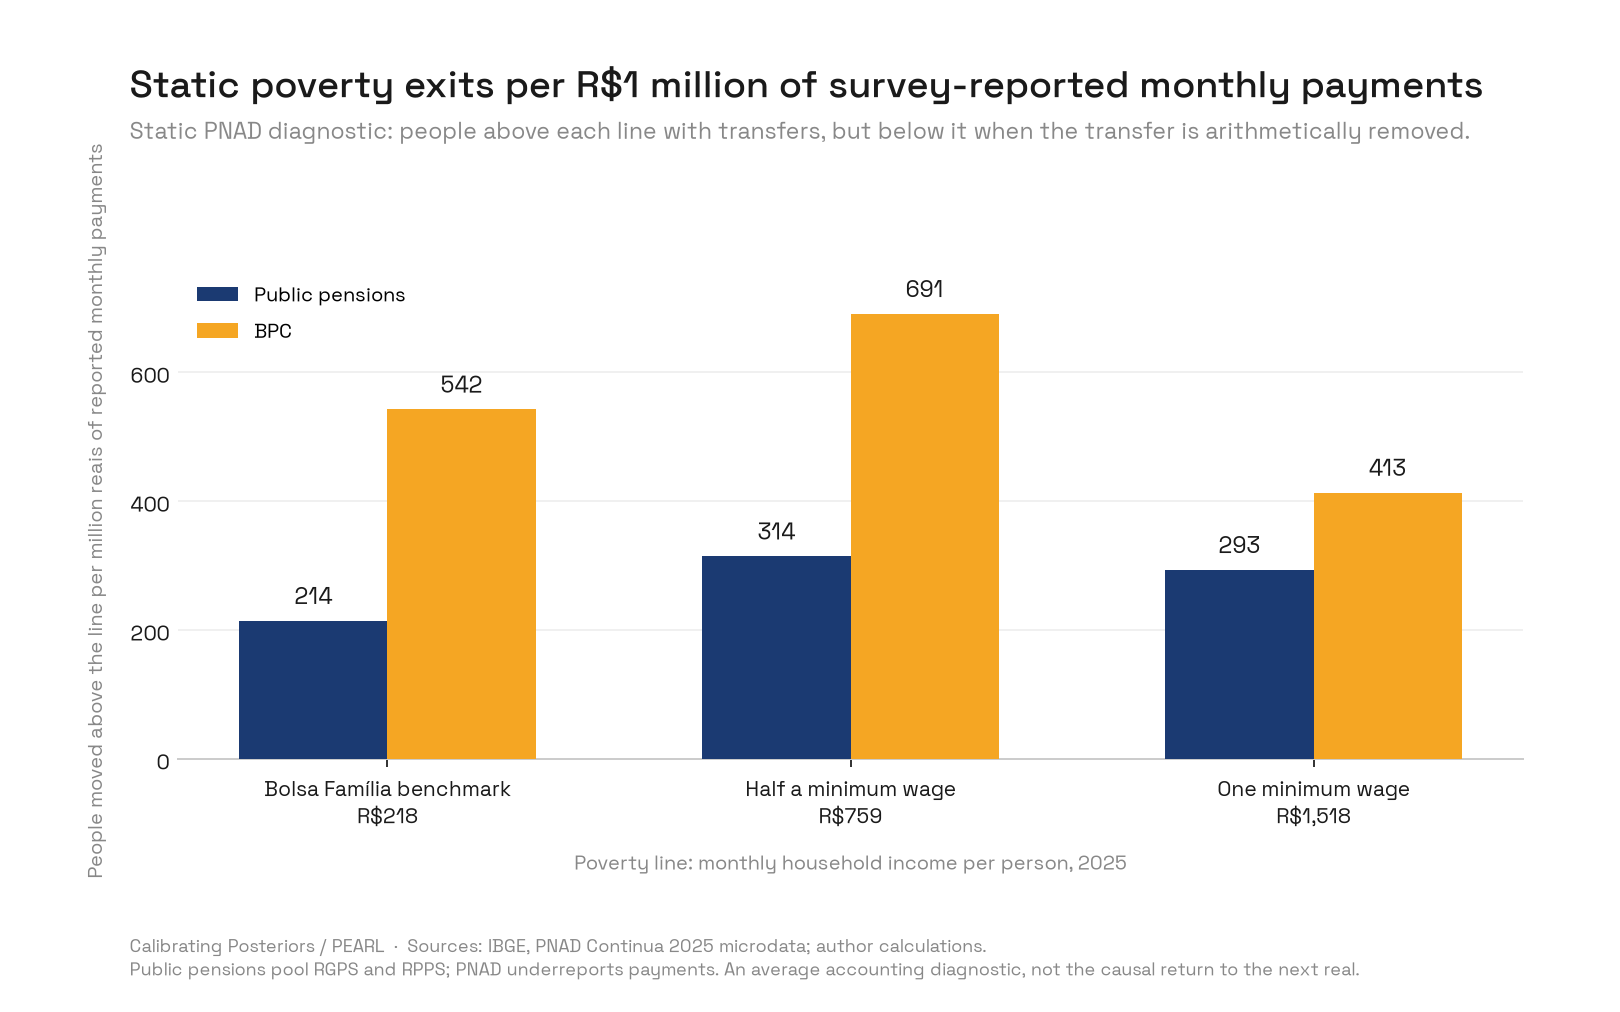
Per R$1 million of reported monthly payments, BPC produces more static poverty exits than pensions at every line: 691 against 314 at half a minimum wage. This compares average effects of existing transfers. It is not the causal effect of the next real spent, and it does not model how families would change work, saving, or living arrangements.
Result 7: lifetime returns rose with income in one federal cohort
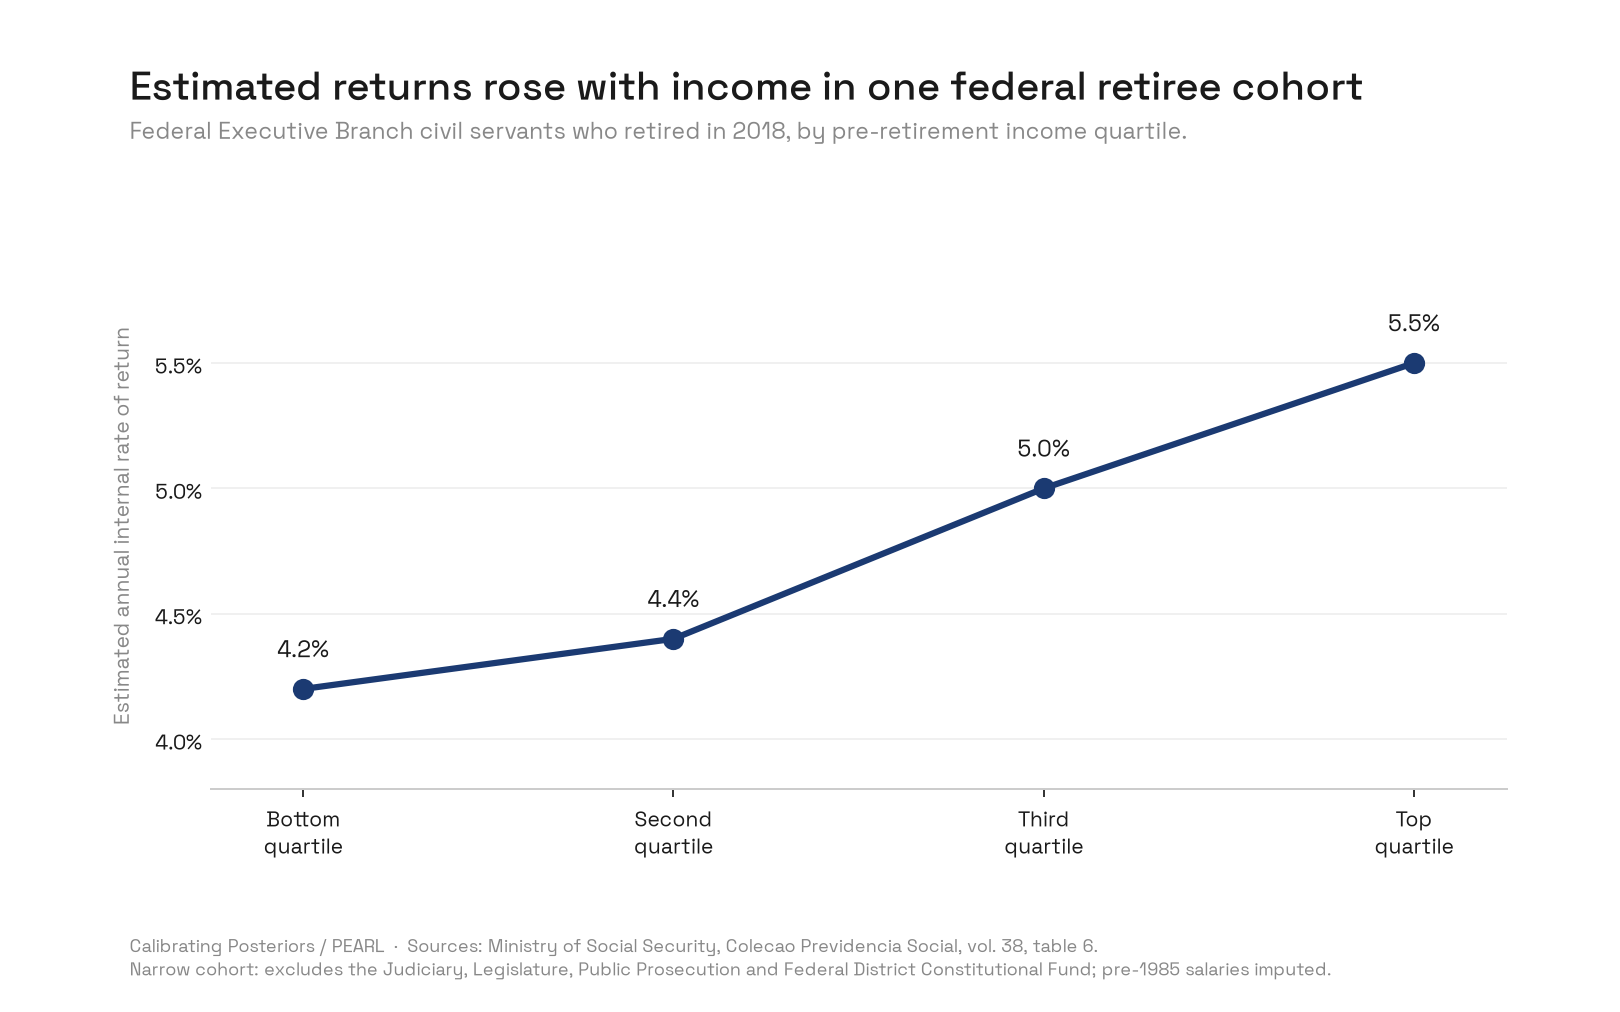
The only lifetime evidence found covers federal Executive civil servants who retired in 2018 [9]. Estimated internal rates of return rose from 4.2% in the bottom pre-retirement income quartile to 5.5% in the top. Women had higher returns than men in every quartile (4.8% to 6.2% against 3.5% to 5.1%), and disability retirements had higher returns than voluntary ones. The authors report a mean of 4.7% a year and characterize the regime as regressive on this measure. They also caution that returns from RGPS and RPPS studies are hard to compare because methods, data, and assumptions differ.
The cohort excludes the Judiciary, Legislature, Public Prosecution, and the Federal District Constitutional Fund, and imputes contribution salaries before 1985. A subsidy estimate would need an explicit benchmark return and fuller treatment of employer contributions, taxes, mortality, and risk. Today's stock of benefits also mixes retirees under older rules with people accruing under newer ones: since 2013, new federal entrants have their base RPPS benefit capped at the RGPS ceiling with access to a complementary fund [12], and EC 103/2019 changed eligibility, formulas, and contribution rules [13].
Net receivers: what can and cannot be counted
PNAD 2025 classifies participation, not net cash:
| Status, 2025 | People (millions) |
|---|---|
| Contributor only | 65.2 |
| Pension or BPC recipient only | 31.4 |
| Both | 2.3 |
| Neither | 113.7 |
These groups do not measure who gains or loses. A contributor may receive more than she pays; a non-contributor pays consumption taxes; employer contributions and deficit-financing taxes fall on workers, consumers, owners, or future taxpayers. The World Bank's comprehensive 2019 analysis gives the closest available boundary: the bottom 30–40% of the income distribution had a positive average cash position after direct transfers, direct taxes and contributions, indirect taxes, and subsidies, and adding public health and education moved the boundary to the bottom 60–70% [8]. These are group averages, not person counts, and no exact current direct-cash net-receiver share exists.
Synthesis: four tests, four answers
| Test | What it shows | Scope |
|---|---|---|
| Benefit incidence | BPC pro-poor; RGPS less concentrated than income; RPPS much more concentrated | POF 2017–2018, by program |
| Financing incidence | Participation rises with income; among payers the poorest bear the most | Direct contributions only |
| Poverty protection | Pensions prevent much poverty; BPC more exits per real | PNAD 2025, pooled regimes, static |
| Lifetime returns | Returns rise with prior income | One federal Executive cohort |
The answer depends on the program and the test. The tests do not combine into one progressivity coefficient for the whole pension state.
Mechanisms
Three design features explain most of the pattern. A floor indexed to the minimum wage concentrates RGPS recipients at one value and makes the regime's benefits less concentrated than income. Legacy civil-service rules that replaced final salaries, with parity indexation for older cohorts, carry high pre-retirement incomes into retirement and produce RPPS concentration near the top. Means-testing places BPC at the bottom. Lifetime returns rise with income when benefit formulas reward career-end salaries and longer life expectancy at higher incomes lengthens benefit duration.
Competing explanations
- Concentration reflects contributions, not privilege. Higher RPPS benefits partly reflect higher contributions on higher salaries. The lifetime-return evidence, which nets contributions, still shows returns rising with income in the one cohort measured.
- Military pensions are compensation, not welfare. Military careers carry constitutional bans on unionization and strikes [14], and the government cites exclusive dedication, continuous availability, and high-risk missions [15]. These are reasons to evaluate total career compensation; they do not determine the pension level or who finances the shortfall.
- Reliance. Many civil servants arranged careers around statutory promises. That is an argument about transition rules, not about the distributional facts.
Evidence quality and limitations
The counting and band results rest on complete administrative tables; the survey results on a large national sample with known underreporting; the incidence results on published studies with dated reference years. The following questions cannot be answered from current public data, and the paper does not estimate them:
- An exact current direct-cash net-receiver share.
- An exact cross-regime unique pension-recipient total.
- A national judge-only count of retirees with a pension-only flow.
- A current national prosecutor-only pension flow.
- A poverty-efficiency ranking that separates rural RGPS, urban RGPS, RPPS, and military benefits.
- An all-regime lifetime-subsidy model.
- A continuously comparable realized worker-support series back to 1964, treated in the companion paper [17].
Further limits: POF 2017–2018 predates the 2019 reform; the lifetime study covers one cohort and branch; PNAD cannot identify regime or occupation.
Counterevidence
RGPS, which carries about two-thirds of pension spending, is the less-concentrated regime, and its floor reaches half its recipients. Its concentration fell between the two POF surveys. Removing pensions raises poverty by more than BPC does in absolute numbers simply because pensions are much larger. Newer federal entrants face capped benefits, so current RPPS concentration describes a legacy stock more than the rules facing new hires.
Verdict and calibrated confidence
Brazil's public pension money combines a broad floor that prevents much poverty with a civil-service component whose benefits are concentrated near the top of the income distribution. Confidence about 85%: administrative bands, survey tails, benefit-incidence coefficients, and one lifetime study point the same way, with different scopes.
BPC delivers more static poverty protection per real than pooled pensions. Confidence about 80%; the result holds at three poverty lines but is a static average comparison.
The share of pension spending that protects against hardship versus the share that preserves high prior incomes cannot be quantified from public data. Confidence about 90% that this is a data gap rather than an unfinished search.
Reversal conditions
- Linked current microdata showing RPPS benefits no more concentrated than income.
- A full financing-incidence model, including employer contributions and deficit-financing taxes, that erases the rise of lifetime returns with income.
- Evidence that current accrual rules confine remaining RPPS concentration to a rapidly shrinking legacy stock.
- Separate regime identification in household data reversing the BPC-versus-pension comparison for the pension floor alone.
Reproducibility
Inputs, scripts, and processed tables live in the research package substack/02-research/previdencia-brazil/ of the program repository, with checksummed raw sources, extraction scripts, and processed CSVs for every number above. The figures are regenerated by projects/homepage/scripts/build_paper_figures_previdencia.py.
References
- Ministério da Previdência Social. AEPS 2024, table C.1: active benefits by clientele and benefit group, December. gov.br
- Ministério da Previdência Social. AEPS 2024, table 26.1: active beneficiaries by number of benefits. gov.br
- Ministério da Previdência Social. AEPS 2024, table 26.6: RGPS beneficiaries and values by benefit band. gov.br
- Ministério da Previdência Social. Estatísticas e informações dos RPPS (2024/2025 supplement, including the Union civil-regime branch workbook). gov.br
- IBGE. Pesquisa Nacional por Amostra de Domicílios Contínua, 2025 annual microdata, first visit. ftp.ibge.gov.br
- Hoffmann R, Vaz DV. Mensurando a desigualdade no Brasil: evidências a partir da renda e dos gastos das famílias. Texto para Discussão 63, IEPE/Casa das Garças, 2020. iepecdg.com.br
- Carvalho Junior PHB. A progressividade dos tributos diretos nas Pesquisas de Orçamentos Familiares (POFs) 2008-2009 e 2017-2018. Texto para Discussão 2645, Ipea, 2021. repositorio.ipea.gov.br
- Lara Ibarra G, Cabrera M, Conceição O, Campante Vale R. Poverty and Inequality Implications of Fiscal Policies: The Case of Brazil. Policy Research Working Paper 10495, World Bank, 2023 (2019 data). documents.worldbank.org
- Pires GMV, Rodrigues AA. Análise da equidade no RPPS da União por meio da taxa de reposição e da taxa interna de retorno. In: Adequação e equidade na política previdenciária: indicadores para o Brasil. Coleção Previdência Social, v. 38, chapter 11. Ministério do Trabalho e Previdência, 2021. gov.br
- Conselho Nacional de Justiça. Justiça em Números 2026. cnj.jus.br
- Conselho Nacional do Ministério Público. Ministério Público: um retrato (2024 data). cnmp.mp.br
- Ministério da Gestão e da Inovação em Serviços Públicos. Previdência complementar do servidor público federal. gov.br
- Brasil. Emenda Constitucional nº 103, de 12 de novembro de 2019. planalto.gov.br
- Brasil. Constituição da República Federativa do Brasil, art. 142, §3º, IV. planalto.gov.br
- Presidência da República. Exposição de Motivos nº 1.293/2025 (military compensation). planalto.gov.br
- Ministério do Planejamento e Orçamento. PLDO 2027, Anexo IV.10: Avaliação atuarial do RGPS. gov.br
- How Many Brazilians Does Each Worker Support? Support Ratios and the Pension Bill, 1950–2100. Piccini Papers, PIC:2610.25. piccini.app