Demography · Public finance · Original descriptive analysis
How Many Brazilians Does Each Worker Support? Support Ratios and the Pension Bill, 1950–2100
Brazil now has 1.07 non-employed residents for every employed resident, down from 1.71 in 1976, and every standard support measure reached its most favorable level between 2017 and 2025. Over the same years the main pension regime nearly doubled its claim on GDP, mostly because benefit records per resident rose. The age-structure advantage is now ending, and the official current-rules path doubles RGPS spending again by 2100.
Abstract
How many people does each Brazilian worker support, how has that changed, and how does it compare with the cost of the public pension system? Using PNAD Contínua microdata, an IBGE 1976 checkpoint, UN World Population Prospects 2024, National Transfer Accounts indicators, Ministry of Social Security administrative series, and the official PLDO 2027 actuarial projection, this paper reconstructs three support measures and the money burden of the General Social Security Regime (RGPS). Realized support improved sharply: non-employed residents per employed resident fell from 1.713 in a matched 1976 checkpoint to 1.065 in 2025, of which 0.402 are children, 0.463 are non-employed people aged 15–64, and 0.201 are older nonworkers. Demographic dependency, employment-based support, and age-weighted economic support all reach their low-burden point between 2017 and 2025 and then rise. The money burden moved the other way. RGPS benefit spending rose from 4.6% of GDP in 1995 to 8.0% in 2024 while net revenue rose from 4.6% to 5.5%; mapped spending across all public pension systems reached about 12.4% of GDP in 2024. A mechanical decomposition attributes about 94% of the 1995–2023 rise in RGPS spending relative to GDP to more benefit records per resident, with expense per record roughly flat relative to GDP per person. Under the official current-rules baseline, RGPS spending reaches 16.76% of GDP in 2100 against revenue near 6.4%. The analysis is descriptive: it does not show that pension spending caused weak productivity or investment, and Brazil publishes no comparable all-regime historical series.
Brazil's support ratios reached their most favorable point between 2017 and 2025 — 1.065 non-employed residents per employed resident in 2025, versus 1.713 in 1976 — while RGPS benefit spending rose from 4.6% to 8.0% of GDP (1995–2024), about 94% of it through more benefit records per resident; the official current-rules path takes RGPS spending to 16.76% of GDP by 2100.
The question
How many people does each Brazilian worker support, how has that number changed since the 1970s, where is it going by 2100, and how does it compare with the money the state spends on public pensions?
The question sounds simple and is usually answered badly. Public debate tends to quote one ratio, usually retirees per contributor or the old-age dependency ratio, as if it measured everything. These ratios answer different questions. A demographic ratio counts people by age. A realized ratio counts people by whether they work. An economic ratio weights each age by what people typically earn and consume. A pension ratio counts beneficiaries against contributors in one regime. A money ratio compares spending with the income or output that pays for it. This paper estimates all five on documented definitions and asks whether they tell the same story.
They do not. The people ratios improved for most of the last half-century. The money ratio for the main pension regime worsened through the same period.
Why it matters
Brazil spent about 12.4% of GDP on public pension systems in 2024 [10, 11]. The main regime alone, the General Social Security Regime (RGPS), ran a financing gap of about 2.5% of GDP [7]. The country is also near the end of the period in which its age structure made support easier: the large cohorts born during high fertility are reaching retirement, and fertility has been below replacement since the mid-2000s [4].
Any reform debate depends on which of these facts is the binding one. If the support problem were mainly demographic, little could be done except wait or raise taxes. If it were mainly a matter of how many claims the system grants and how they are priced, rules could change it. Separating the two requires keeping people, records, and money apart, which is what this paper does.
Data and definitions
The analysis uses a research package in which every headline value is regenerated by scripts from stored, checksummed inputs (see Reproducibility). The main definitions are fixed before any result is reported.
- Worker. Any employed resident in PNAD Contínua, whether formal or informal, an employee, self-employed, a civil servant, military, or aged 65 and over. Contribution status does not decide who counts as a worker [1, 2].
- Realized support. Non-employed residents per employed resident: (population − employed) / employed. The 2025 value comes from the PNAD Contínua 2025 annual first-visit microdata [1]; 2012–2025 from IBGE's annual tables [2]; 1976 from a matched IBGE checkpoint with the same coverage in numerator and denominator [3].
- Demographic dependency. Residents aged 0–14 and 65+ per resident aged 15–64, from UN World Population Prospects 2024, medium variant, 1950–2100 [4]. A 60+ convention is reported as a sensitivity.
- Economic support. Effective workers per 100 effective consumers from the National Transfer Accounts (NTA) indicators, which weight each age by fixed profiles of labor income and consumption [5]. Its inverse, effective consumers per effective worker, is the burden version.
- Pension support. Unique RGPS and EPU beneficiaries per average monthly contributor, from the Ministry of Social Security's statistical yearbook (AEPS), 2016–2024 [9].
- Money burden. RGPS net revenue, benefit spending, and financing gap as shares of GDP, 1995–2024 [7]; RGPS benefits per R$100 of PNAD labor income, 2014–2024 [8, 20].
- Projection. Population scenarios combine UN and IBGE projections [4, 6] with 2025 age-specific employment rates held fixed, plus or minus five percentage points. The fiscal path is the official PLDO 2027 actuarial projection for RGPS [15].
A benefit record is one entitlement, not one person. Someone receiving a retirement benefit and a survivor pension appears twice. The companion paper [22] measures people separately.
Result 1: each worker supports far fewer people than in 1976
In 2025 PNAD estimated 212.7 million people in its household universe and 103.0 million employed residents, or 1.065 non-employed residents per employed resident [1]. The provisional April–June 2026 snapshot gives 1.072. The matched 1976 checkpoint, which excludes the rural zone of the North and Center-West as IBGE's survey then did, gives 1.713 [3]. The comparable annual series falls from 1.208 in 2012 to 1.065 in 2025, with a pandemic spike in 2020.
The 2025 burden decomposes as follows:
| Group, 2025 | People (millions) | Per employed resident |
|---|---|---|
| Non-employed children aged 0–14 | 41.4 | 0.402 |
| Non-employed residents aged 15–64 | 47.7 | 0.463 |
| of whom unemployed | 6.0 | 0.059 |
| of whom outside the labor force | 41.6 | 0.404 |
| Non-employed residents aged 65+ | 20.7 | 0.201 |
| Total | 109.7 | 1.065 |
The largest group is working-age adults who do not work, not older people. About 3.9 million employed Brazilians are 65 or older; an age-based ratio places them on the dependent side, while this measure counts them as workers.
Two sensitivities matter. If the 12.7 million employed in public-sector main jobs are treated as financed by the rest, so that only non-public workers count as supporters, the ratio rises from 1.065 to 1.356. That reclassification is an accounting device, not a claim that public employment is unproductive. And the realized series cannot be extended continuously back to 1964: survey concepts, minimum ages, and geographic coverage change, so the 1976 point is a checkpoint, not the start of a series.
Result 2: every support measure turns between 2017 and 2025
Figure 1 puts the four people-based measures on a common burden index.
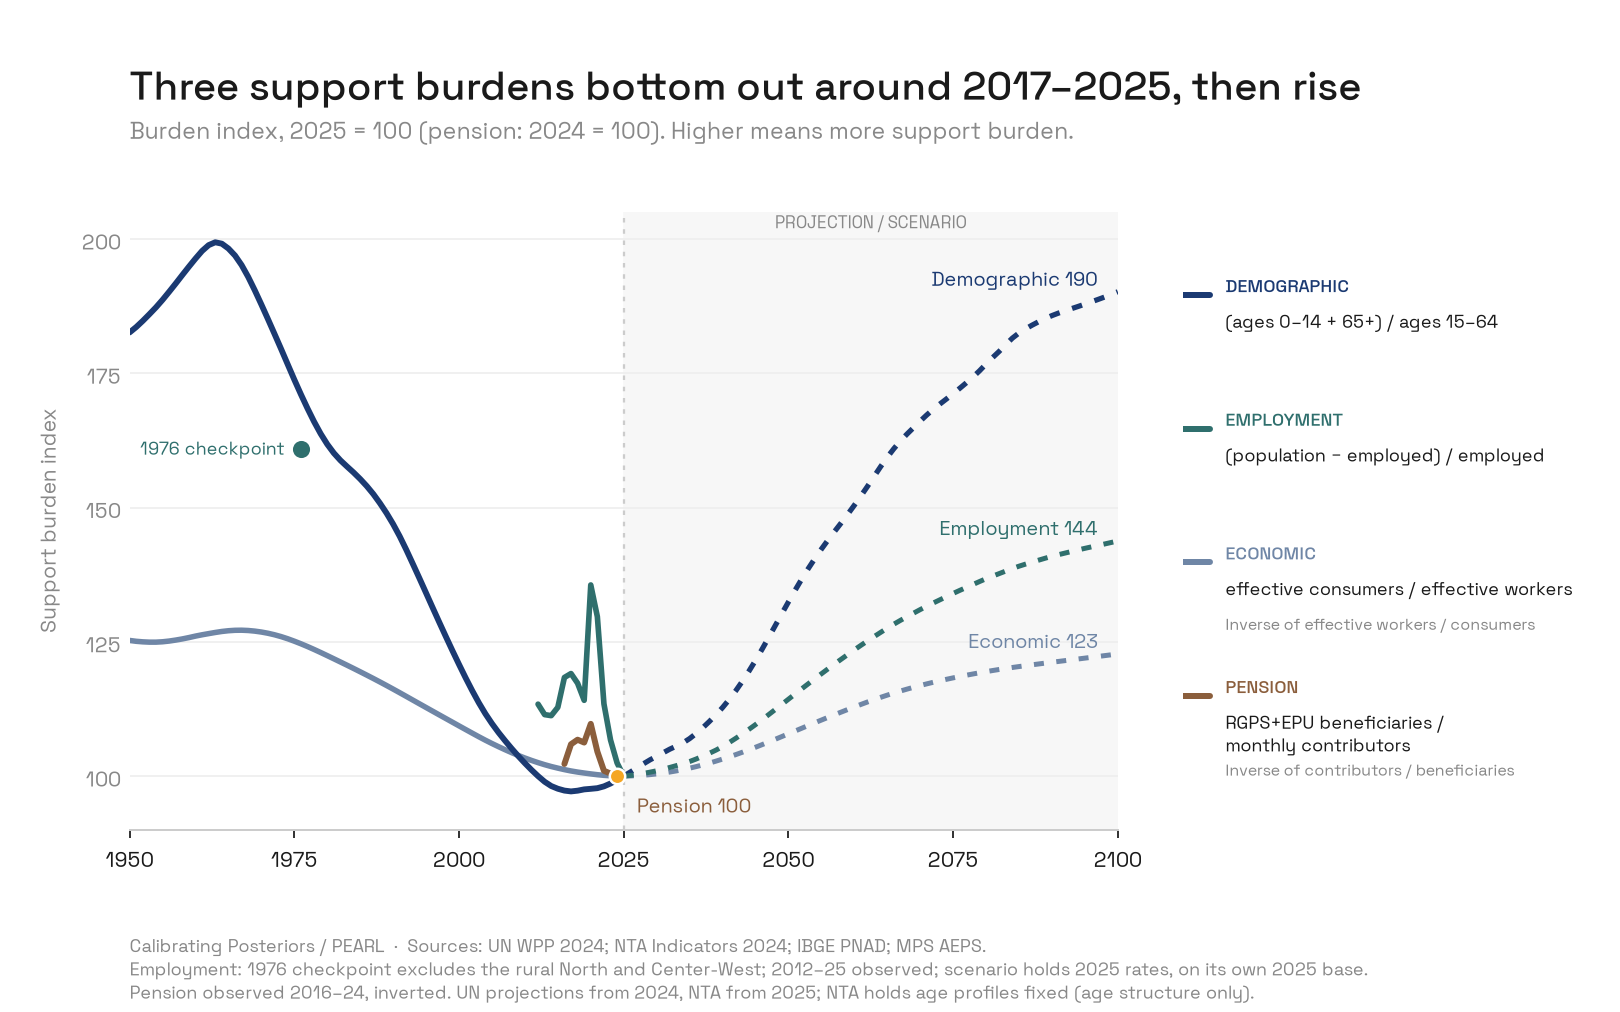
The measures agree on timing. Demographic dependency under the 15–64 convention reaches its minimum of 0.434 in 2017 and stood at 0.446 in 2025; it was 0.764 in 1976 and reaches 0.849 by 2100, above its 1976 level because older dependents replace children [4]. Under the 60+ convention the ratio crosses one dependent per working-age resident before 2100. Age-weighted economic support peaks in 2025 at 65.6 effective workers per 100 effective consumers and falls to 53.5 by 2100; its burden version returns almost to its 1976 level (1.870 against 1.899) [5]. Realized support under fixed 2025 employment rates reaches 1.21 in 2050, 1.39 in 2070, and 1.52 in 2100, still below the 1976 checkpoint [4, 1].
The employment assumption matters more than the population projection. Shifting every age-specific employment rate by five percentage points moves the 2100 value from 1.27 to 1.81; the IBGE and UN populations give nearly identical 2070 values (1.395 and 1.387). The pension ratio, observed only from 2016, worsened from 0.497 beneficiaries per contributor to 0.533 in 2020 and recovered to 0.486 in 2024, its best observed value [9].
These measures share demographic inputs, so their common turning point is one finding expressed four ways, not four independent confirmations.
Result 3: the pension bill is larger than the main regime
Brazil's public pension state has several regimes: RGPS for private-sector workers and some public employees; civil-service regimes (RPPS) for statutory civil servants of the Union, states, and municipalities; separate military systems; and small legacy federal obligations. The means-tested Continuous Cash Benefit (BPC) is assistance, not a pension, and is kept outside.
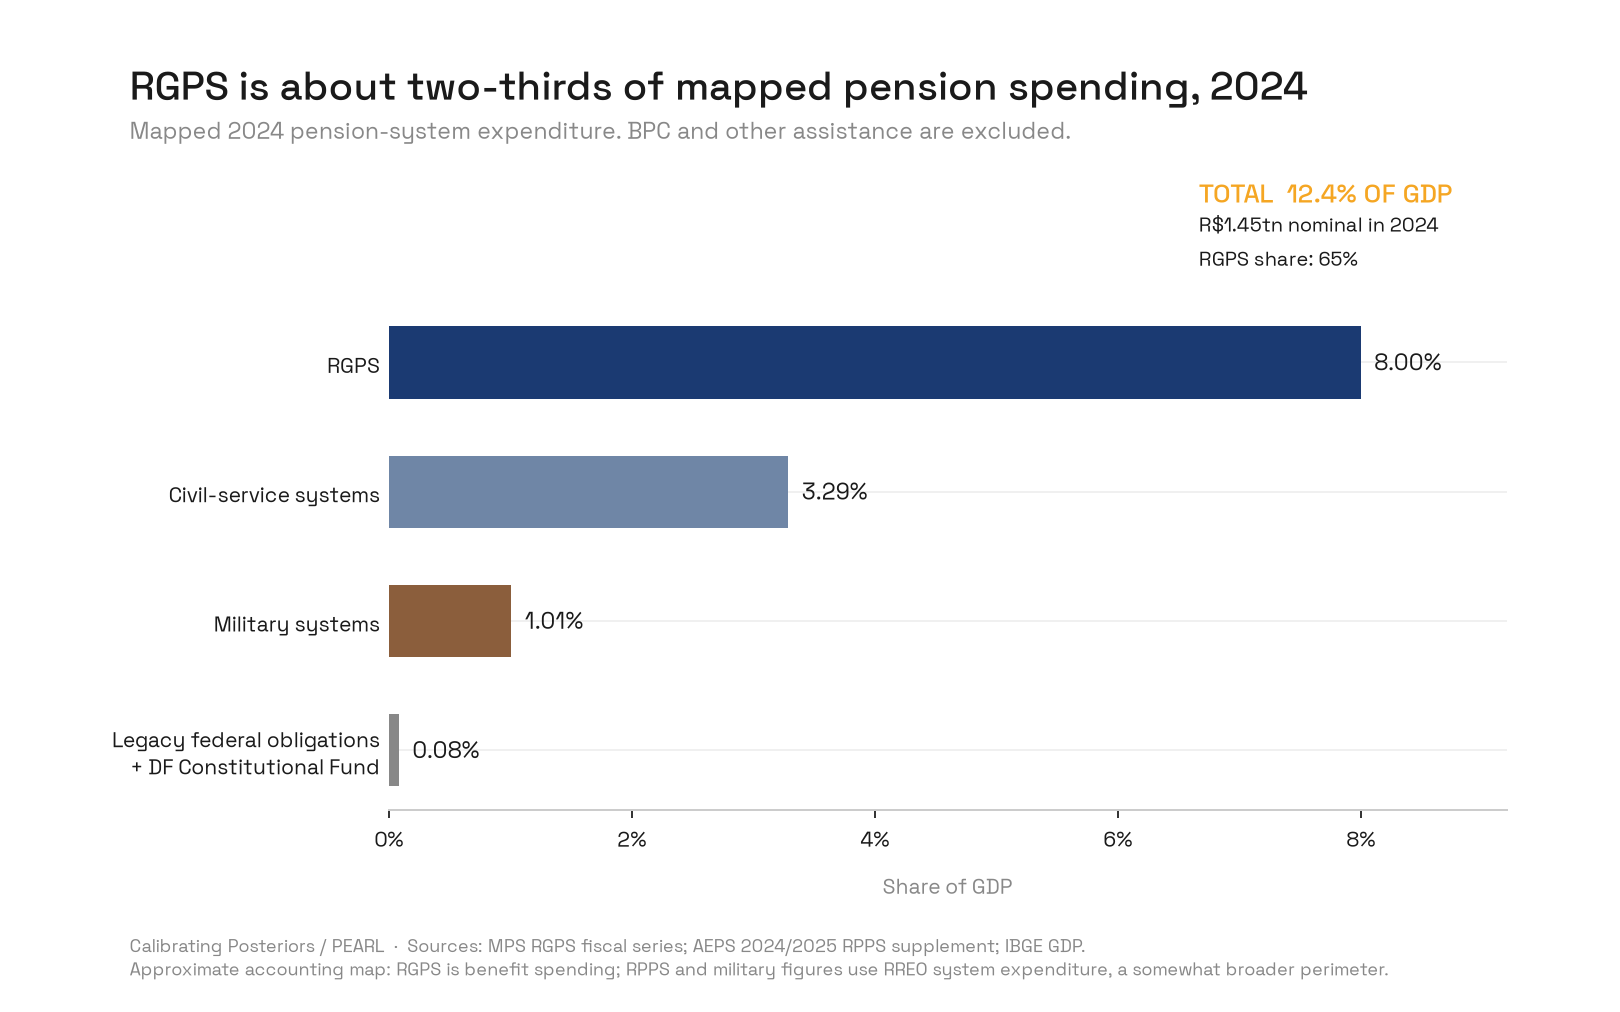
Mapped 2024 expenditure totals about R$1.45 trillion, or 12.4% of GDP [7, 9, 10]. RGPS is 8.00% of GDP, civil RPPS 3.29%, military systems 1.01%, and legacy federal obligations with the Federal District Constitutional Fund 0.08%. BPC and other INSS-administered assistance add about 0.78% outside the total. The map mixes accounting perimeters (RGPS benefit flows; civil and military RREO system expenditure), so it is a scale estimate rather than a harmonized national-accounts aggregate. An independent Ipea reconstruction reached the same 12.4% for 2022, with RGPS at 64% [11].
Adding the reported 2024 RGPS shortfall to the financial results of the civil and military systems gives a combined gap of about R$559 billion, 4.8% of GDP; Ipea's reconstruction found 4.9% for 2022 [10, 11]. Because the perimeters differ, this is also a scale estimate.
Brazil publishes no comparable all-regime spending history, and the projections for the Union civil and military systems use closed groups and replacement scenarios that cannot be summed with RGPS [16]. The time-series results below therefore cover RGPS only, roughly two-thirds of the bill.
Result 4: fewer people per worker, more money per worker
Between 2014 and 2024, non-employed residents per employed resident fell from about 1.19 to 1.09. Over the same decade, RGPS benefits rose from about R$20.20 to R$23.72 per R$100 of annual labor income, after peaking at R$26.84 in 2021 [8, 20]. The levels combine two fixed-price series with different deflators and are approximate; the trend within each series is not affected. Net RGPS revenue covered 85.6% of benefit spending in 2014 and 68.2% in 2024.
Two candidate explanations fail the available tests for 2016–2024.
- A retreat from contributing. The share of employed residents contributing to a pension institute was 65.3% in 2016 and 65.0% in 2024 [2], while administrative contribution months per annual contributor rose from 9.33 to 9.74 [21]. These aggregates cannot detect lower declared bases within groups such as individual micro-entrepreneurs, but they show no broad retreat.
- Average benefits outrunning incomes. From 2016 to 2024, the average real RGPS benefit rose 3.4% while real labor income per employed resident rose about 7.6% [8, 20]. This was not true earlier: from 1995 to 2010 the average INSS-administered payment grew much faster than formal private earnings [17].
Result 5: the RGPS bill outgrew three capacity measures, 1995–2024
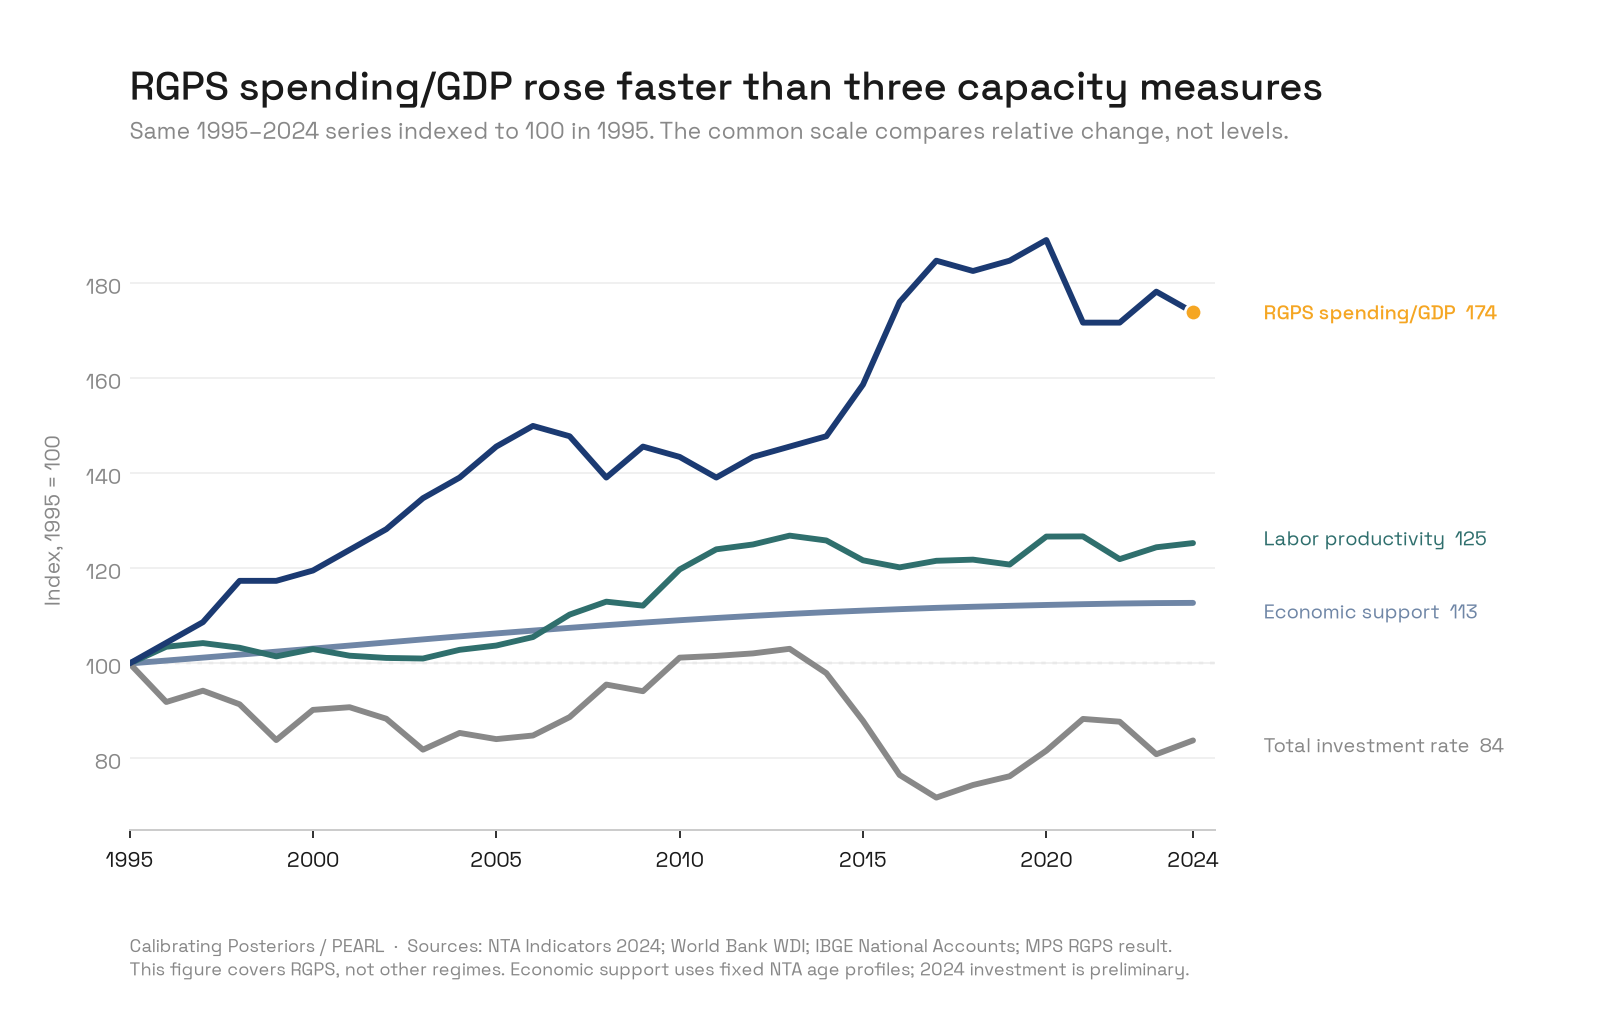
Between 1995 and 2024, NTA economic support rose from 58.2 to 65.6 effective workers per 100 effective consumers, a 12.7% gain in age-structure capacity [5]. Labor productivity, measured as GDP per employed person in constant 2021 PPP dollars, rose 25.3%, a compound 0.78% a year: 0.32% a year in 1995–2004, 2.17% in 2005–2014, and 0.33% in 2015–2024 [13]. The investment rate ended at 17.0% of GDP, below its 20.3% in 1995 [12]. RGPS benefit spending rose from 4.6% to 8.0% of GDP while net revenue rose from 4.6% to 5.5%, leaving a 2.5%-of-GDP gap in 2024 [7].
In 2024 that gap was 3.42 times Central Government investment, 0.73% of GDP under the Treasury's paid-primary-spending definition [14]. Summing the annual RGPS gaps from 1995 to 2024 gives about R$4.56 trillion in July 2026 reais, before interest.
The figure shows scale and timing. It does not show that pension spending caused weak productivity or investment; a causal claim would need a design that this accounting cannot supply.
Result 6: more benefit records did most of the accounting work
RGPS spending relative to GDP is the product of two factors: benefit records per resident, and implied annual expense per year-end record (annual spending divided by the record stock) relative to GDP per person.
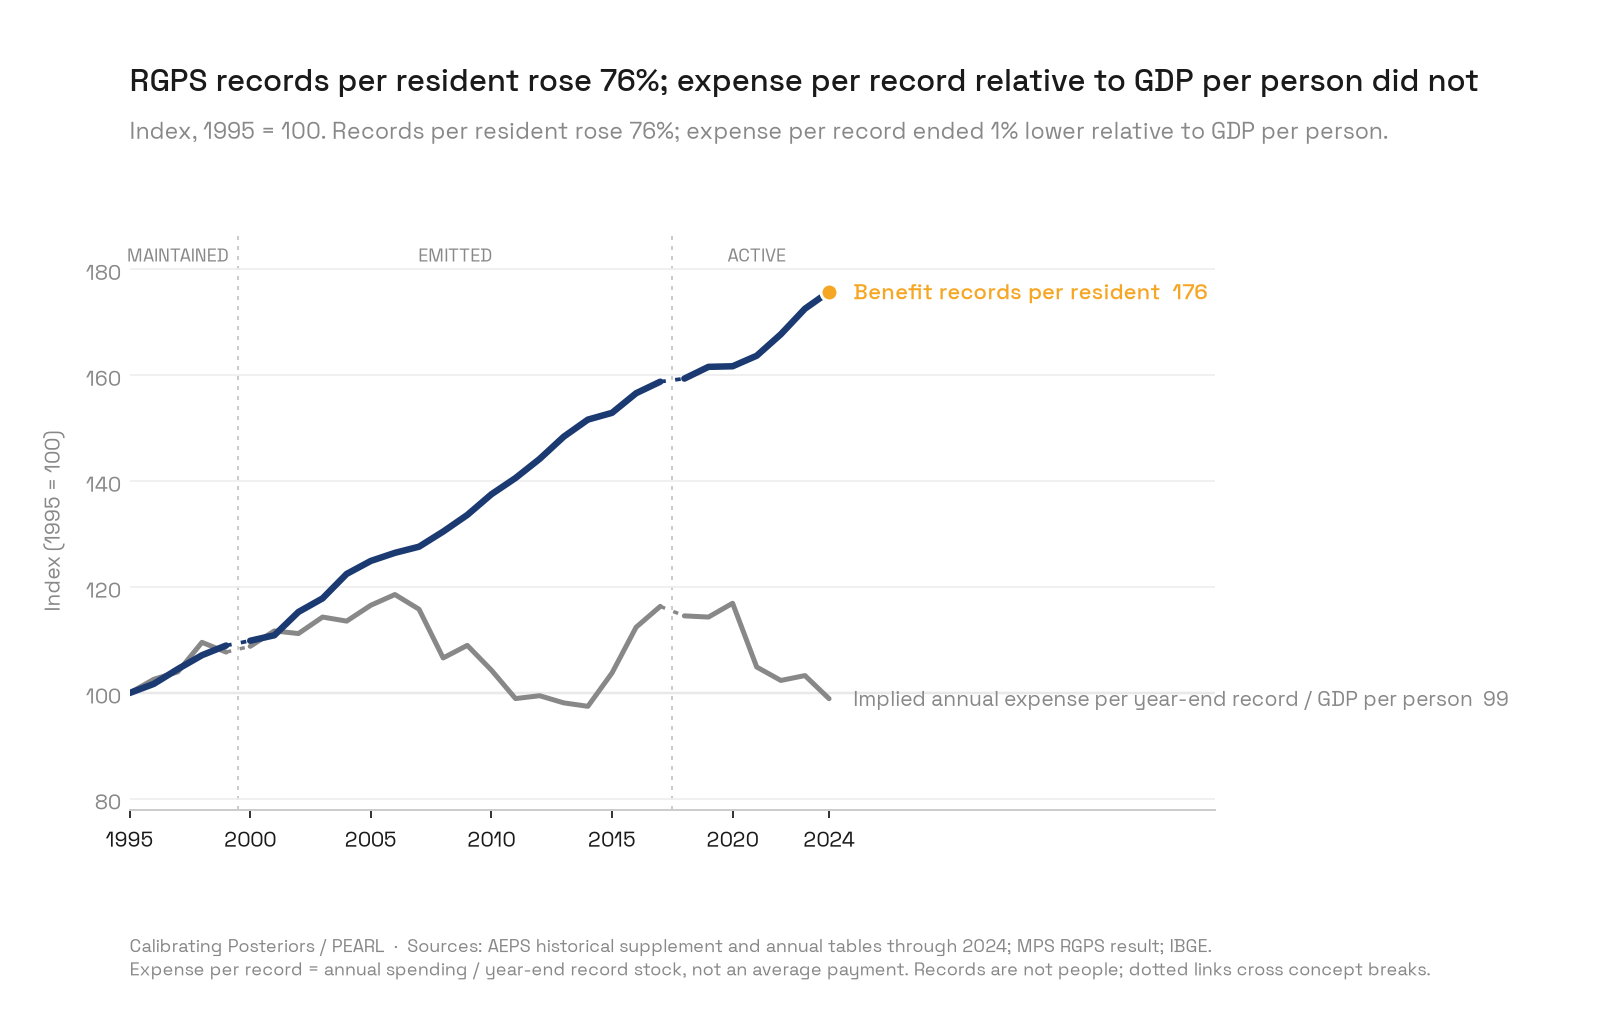
Records rose from 14.8 million in 1995 to 34.2 million in 2024, or from 9.2 to 16.1 per 100 residents [9]. Expense per record relative to GDP per person rose and fell but ended near its 1995 level. In log terms, the rise in records per resident accounts for about 94% of the 1995–2023 increase in RGPS spending relative to GDP. The share depends on the start year: about 88% for 1995–2010 and 113% for 2000–2023, where a value above 100% means the relative amount per record fell and offset part of the increase.
This is a mechanical decomposition. The Ministry of Social Security's own diagnosis names the plausible mechanisms behind more records per resident: population ageing and longer benefit duration, coverage expansion with labor formalization, and eligibility rules that allowed long retirement periods [18]. The 1988 Constitution also expanded rural and minimum-benefit protection. The decomposition cannot assign a share to each.
Result 7: the path to 2100
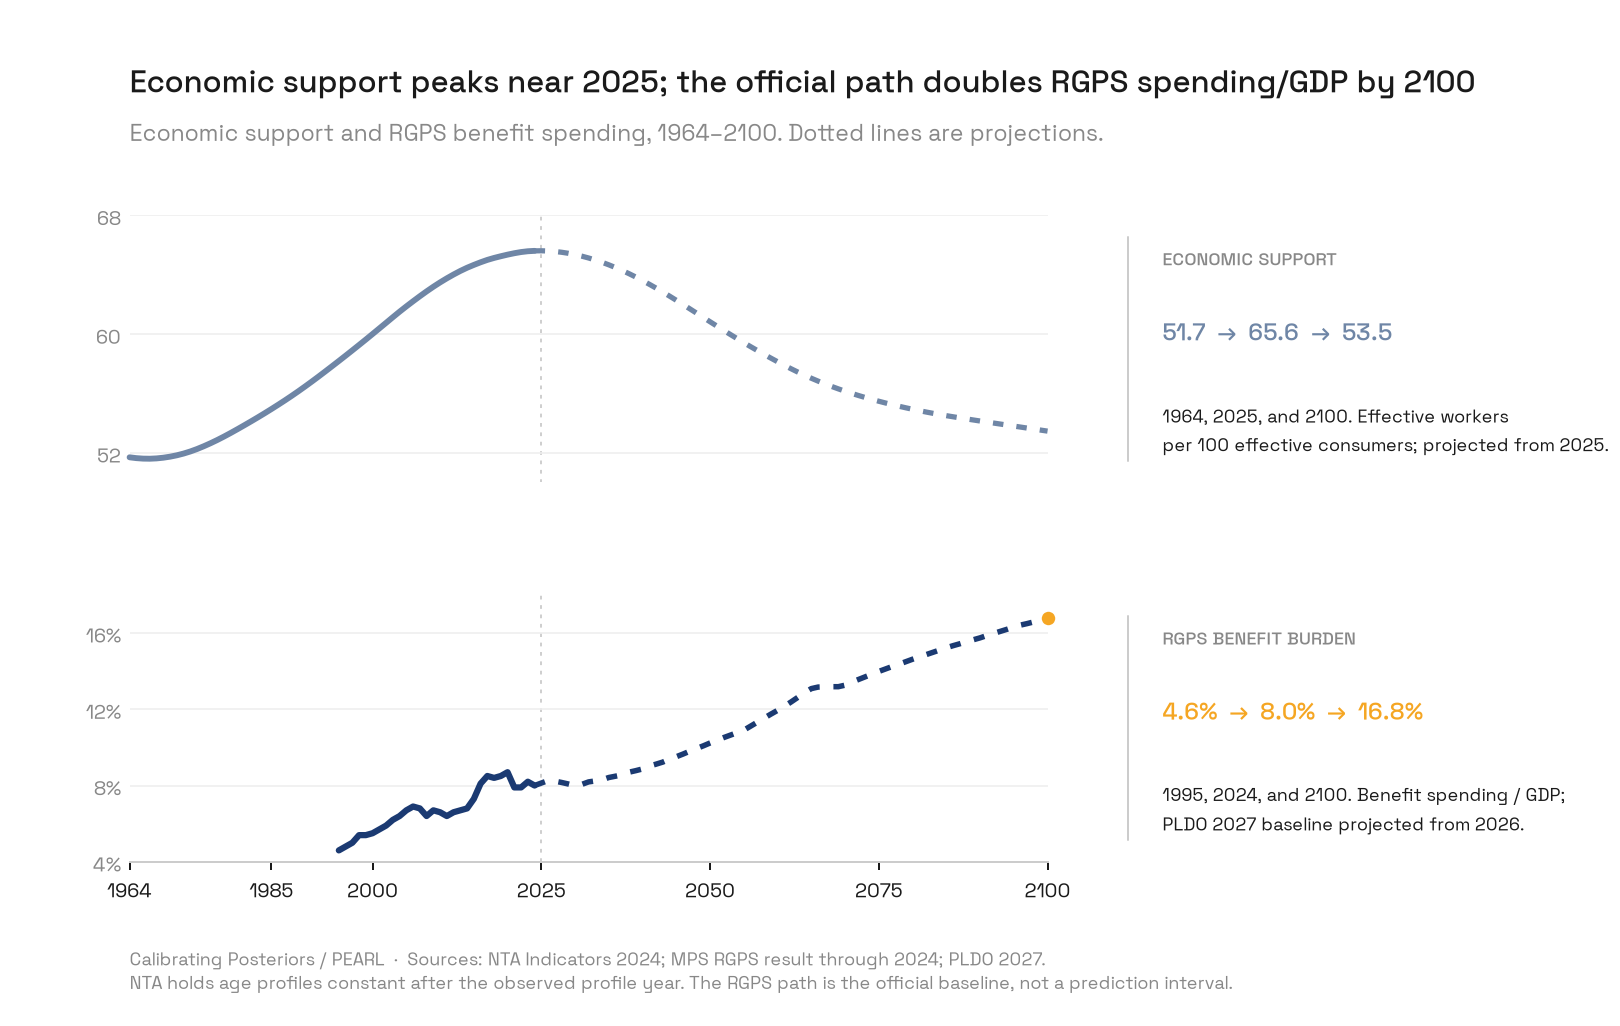
Under fixed NTA age profiles, economic support peaked around 2025 and falls to 53.5 effective workers per 100 effective consumers by 2100 [5]. The official PLDO 2027 baseline for RGPS keeps current rules and stated demographic and macroeconomic assumptions [15]:
| Year | Revenue (% of GDP) | Benefit spending (% of GDP) | Financing need (% of GDP) |
|---|---|---|---|
| 2026 | 5.77 | 8.26 | 2.49 |
| 2030 | 6.54 | 7.99 | 1.45 |
| 2050 | 6.44 | 10.23 | 3.79 |
| 2070 | 6.37 | 13.26 | 6.89 |
| 2100 | 6.35 | 16.76 | 10.41 |
This is a stress test of current rules, not a forecast that rules will stay unchanged for 74 years. It covers RGPS only.
Mechanisms
The results fit one accounting story. A falling birth rate first lowers child dependency and then raises old-age dependency; between those phases, every worker supports fewer people. Brazil's people ratios show exactly that window and its end. A pay-as-you-go pension regime turns the age structure into a claim on current output through the number of entitlements and their value. In Brazil the number of entitlements per resident grew faster than the age structure alone would require, because coverage widened, eligibility allowed early and long retirements, and survivor and rural benefits expanded. Average generosity relative to GDP per person did not trend upward over the whole window, though it did outpace formal wages in 1995–2010.
Competing explanations
- "The problem is demographic." The demographic burden fell for most of the period in which RGPS spending rose. Demography explains the coming pressure better than the past growth.
- "Workers stopped contributing." Aggregate participation and contribution months were stable or rising in 2016–2024. Lower declared bases in some contributor groups remain possible and untested.
- "Benefits became too generous." True for average payments relative to formal wages in 1995–2010, but not over the whole 1995–2024 window relative to GDP per person.
- "The spending bought welfare, not waste." Coverage of rural workers, disability, survivors, and the elderly poor protects people against real risks. The companion paper [22] measures who receives the money; this paper measures only scale and mechanics.
Evidence quality and limitations
The people ratios rest on large official surveys and administrative series, reproduced from stored inputs. The weakest points are known.
- No continuously comparable realized-support series exists before 2012; 1976 is a single matched checkpoint.
- The pension expenditure map mixes accounting perimeters; there is no harmonized all-regime history.
- NTA economic support uses fixed age profiles from earlier data and the 2022 UN projections, so it isolates age structure and does not forecast labor markets.
- The money-per-labor-income ratios combine series deflated by different price indexes; levels are approximate.
- The record decomposition uses year-end stocks with concept breaks in 2000 and 2018.
- Several research questions have no defensible answer from public data: an exact all-regime unique-recipient count, a person-level net-receiver count, judge-only or prosecutor-only pension flows, a regime-specific poverty-efficiency ranking, an all-regime lifetime model, and a realized-support series back to 1964. The companion paper treats the distributional gaps.
Counterevidence
Three facts cut against a simple story of fiscal excess. Pension support per contributor improved after 2020 and reached its best observed level in 2024. Contribution behavior did not deteriorate in aggregate. And the 2019 pension amendment (EC 103/2019) changed eligibility, formulas, and contribution rules in ways that mostly affect future cohorts, so today's stock of records overstates the generosity of rules facing new entrants [19]. The official baseline already incorporates current rules and still rises to 16.76% of GDP.
Verdict and calibrated confidence
Brazil's people ratios reached their most favorable level between 2017 and 2025 and will deteriorate from here. Confidence about 90%: the turn appears in every measure and both population projections, and employment assumptions shift its size but not its direction.
Over 1995–2024 the cost of the main pension regime rose much faster than the country's measured capacity, mostly through more benefit records per resident. Confidence about 85% for the descriptive pattern; the decomposition is robust in sign across start years but sensitive in size.
The official current-rules path implies an RGPS financing need near 10% of GDP by 2100. Confidence about 80% that, absent new rules, the direction and order of magnitude are right; the exact path depends on growth, employment, and indexation assumptions.
Reversal conditions
- A harmonized all-regime spending history showing civil and military systems shrinking fast enough to offset RGPS growth.
- Sustained employment-rate gains well beyond five percentage points at older ages.
- Evidence that recent rule changes cut new grants per resident sharply enough to bend the record curve.
- Productivity growth sustained at the 2005–2014 pace, which would make each GDP point of spending easier to carry without changing the ratios.
Reproducibility
Inputs, scripts, and processed tables live in the research package substack/02-research/previdencia-brazil/ of the program repository: 91 raw-source manifest rows with retrieval dates, byte sizes, and SHA-256 hashes; extraction and analysis scripts; and processed CSVs for every number above. The figures are regenerated by projects/homepage/scripts/build_paper_figures_previdencia.py from those CSVs.
References
- IBGE. Pesquisa Nacional por Amostra de Domicílios Contínua, 2025 annual microdata, first visit. ftp.ibge.gov.br
- IBGE. SIDRA tables 6415, 4360, and 4191: annual population, labor status, and pension contribution, PNAD Contínua 2012–2025. sidra.ibge.gov.br/Tabela/4360
- IBGE. Estatísticas do Século XX: employed persons, 1976 (Anuário Estatístico 1979, table) and matched population (Anuário Estatístico 1977, table).
- United Nations, Department of Economic and Social Affairs, Population Division. World Population Prospects 2024. population.un.org/wpp
- National Transfer Accounts Network. NTA Indicators database, 2024. ntaccounts.org
- IBGE. Projeções da População do Brasil e Unidades da Federação, revisão 2024. ftp.ibge.gov.br
- Ministério da Previdência Social. Resultado do RGPS (revenue, spending, and result as shares of GDP, 1995–2024). gov.br
- Ministério da Previdência Social. Informe de Previdência Social, janeiro de 2025 (real RGPS flows, 2014–2024). gov.br
- Ministério da Previdência Social. Anuário Estatístico da Previdência Social (AEPS), including the 2017 historical supplement and the 2024 tables. gov.br
- Ministério da Previdência Social. Estatísticas e informações dos RPPS (2024/2025 supplement). gov.br
- Ipea. "Previdência social." Políticas Sociais: acompanhamento e análise, n. 31, 2024. repositorio.ipea.gov.br
- IBGE. Sistema de Contas Nacionais 2023, tabela 7 (ftp.ibge.gov.br) and Contas Nacionais Trimestrais, 4º trimestre de 2024 (ftp.ibge.gov.br).
- World Bank. World Development Indicators: GDP per person employed (constant 2021 PPP $), Brazil. data.worldbank.org
- Tesouro Nacional. Resultado do Tesouro Nacional, historical series. tesourotransparente.gov.br
- Ministério do Planejamento e Orçamento. PLDO 2027, Anexo IV.10: Avaliação atuarial do RGPS. gov.br
- Ministério do Planejamento e Orçamento. PLDO 2027, Anexo IV.11: Avaliação atuarial do RPPS da União. gov.br
- Ministério da Previdência Social. Comparison of benefit indexation and wage growth, 1995–2010. gov.br
- Ministério da Economia / Secretaria de Previdência. PEC 6/2019: processo completo com manifestações técnicas. gov.br
- Brasil. Emenda Constitucional nº 103, de 12 de novembro de 2019. planalto.gov.br
- IBGE. SIDRA table 4663: annual labor-income mass, PNAD Contínua 2012–2025. apisidra.ibge.gov.br
- Ministério da Previdência Social. AEPS 2024, table 32.1: contributors (individuals). gov.br
- Who Receives Brazil's Pension Money? Four Distributional Tests of a System Without a Linked Recipient Count. Piccini Papers, PIC:2610.26. piccini.app